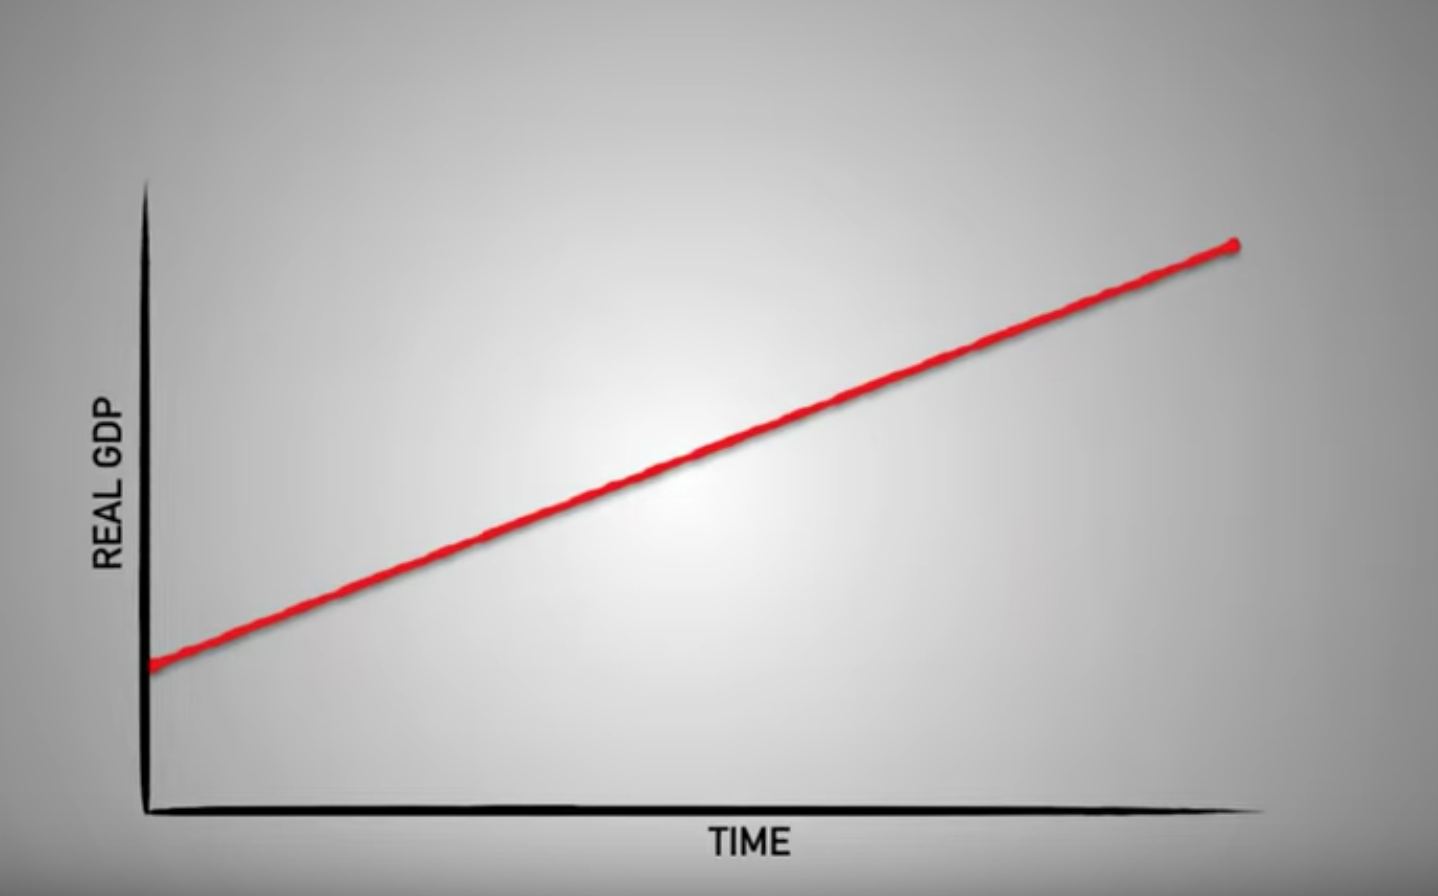
Let’s assume that from the year 1960 to 2018, Nigeria’s economy grew constantly. This means that its Gross Domestic Product (GDP) grew year-on-year, with a corresponding growth in its population and increased productivity. In such a scenario, the chart will look the one below:

Chart 1: Perfect GDP growth
As you can see, the GDP growth trend (red line) is a straight line. However, this isn’t an accurate representation of a typical economic cycle. Why? Because of the absence of supply and demand, the availability of capital, and expectations about the future.
So what is the business cycle and why should we care? The business cycle is a graph that shows us how well economies are doing to meet their goals of preventing unemployment, keeping inflation stable, and promoting long term economic growth (these are the goals of the economy of every country). Another way to think of the business cycle chart as an indicator of the health of the economy.
Need to Know:
|
Real GDP |
Measurement of economic output that accounts for the effects of inflation or deflation |
| Contraction | A period where business revenues go down and companies lay off workers to decrease expenses |
| Expansion | It is a period when the level of business activity surges and gross domestic product (GDP) expands until it reaches a peak |
| Peak | The highest point between the end of an economic expansion and the start of a contraction in a business cycle |
| Recession | A period of temporary economic decline during which trade and industrial activity are reduced, generally identified by a fall in GDP in two successive quarters. |
| Trough |
Marks the end of a period of declining business activity and the transition to an expansion |
Table 1: Definitions
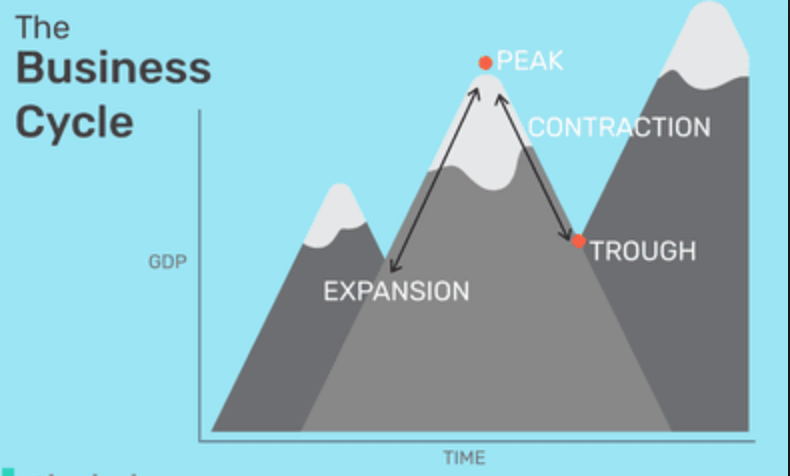
Four distinct phases make up the business cycle: expansion, contraction, trough, and peak
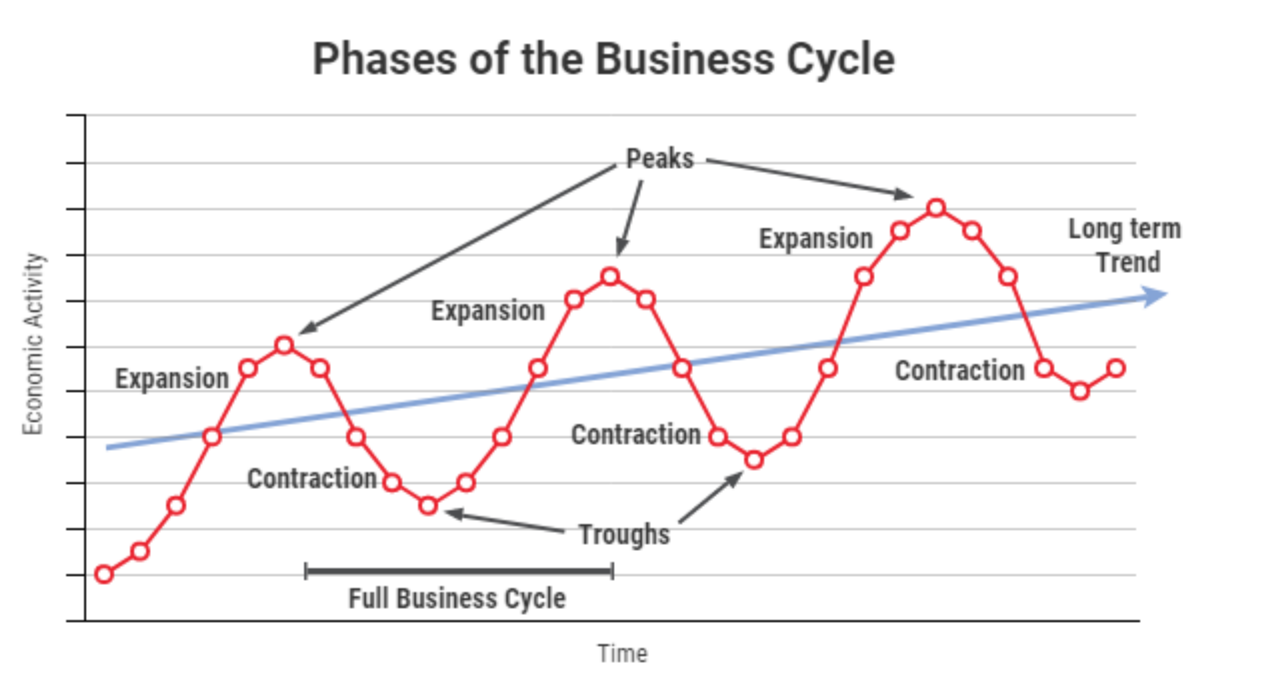
Expansion is the phase of the business cycle when the economy moves from a trough to a peak. During this period, the level of business activity surges and GDP expands until it reaches a peak. A period of expansion is also known as an economic recovery. There is an ebb and flow to the way the economic cycle works: When the economy expands, it is usually followed by a period of contraction. Correspondingly, when the economy contracts, it is usually followed by a period of expansion.

Chart 2: The business cycle
There is an ebb and flow to the way the economic cycle works: When the economy expands, it is usually followed by a period of contraction. Correspondingly, when the economy contracts, it is usually followed by a period of expansion.
When the economy contracts, productivity declines, business revenues go down and companies lay off workers to decrease expenses. Unemployment rises, and consumers spend less. When the GDP declines over two consecutive quarters, a recession occurs. When productivity and revenue slowly begin increasing, economic recovery begins. The unemployment rate decreases as consumers spend more and the economy begins expanding.

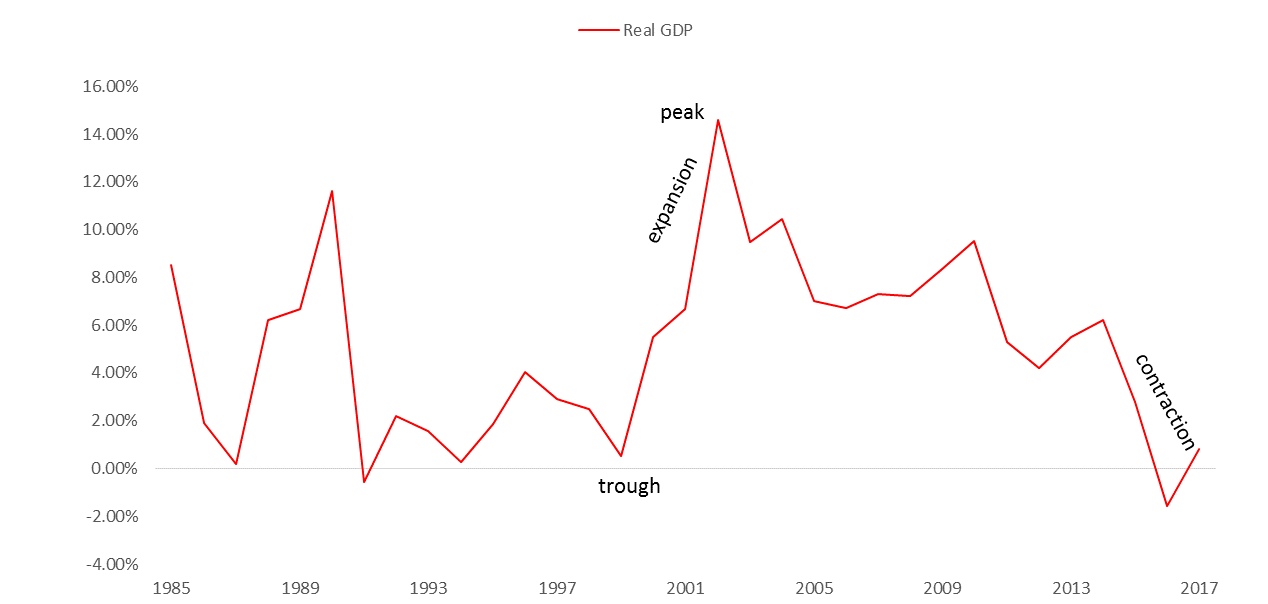
Chart 3: Nigeria’s GDP growth rate (1985 to 2017). Source: Central Bank of Nigeria (CBN)
Investors know it is impossible to time the market perfectly. However, an understanding of the business cycle improves ones chances of better returns (by being able to interpret the business cycle chart). This allows investors adjust their asset allocation to take advantage of the phases.
Chart 3 above shows us Nigeria’s GDP growth rate between 1985 to 2016. Looking at the movement of the chart, we can see that Nigeria is currently heading towards an upward trend from 2017, after being in recession in 2016 ( GDP growth rate of 0.80% in FY-2017). Nigeria suffered a contraction in economic activities in 1990, before reaching the trough in 1991.
The economy recovered in 1992 and continued to expand before reaching its peak in 2003. We saw a slowdown in economic activities from 2004 to 2009, then a recovery in 2010. In 2011 and 2014, Nigeria’s economy expanded further, as a result of sound macroeconomic policies and increased inflow from crude oil sales. However, due to a slump in crude oil prices at the international market, the economy contracted in 2015 and slid into recession in Q1-2016.
The above illustration enables you to understand how economy behaviour changed over the period. The one major criticism against this indicator, is that it is impossible to know for sure what point of the cycle the economy is in, until after it has occurred.
Key takeaways:
- The goal of every economy is to reduce unemployment, keep inflation stable, and promote long term economic growth
- The business cycle (as known as the economic cycle) shows the relationship between GDP and time
- Investors need to understand different stages of the economic cycle. People who recognise the state of the business cycle can get out of the stock market before it crashes completely
- When the GDP declines over two consecutive quarters, a recession occurs
- It also assists the investor to capitalise via asset reallocation after successfully forecasting market conditions
- When the economy expands, it is usually followed by a period of contraction. Correspondingly, when the economy contracts, it is usually followed by a period of expansion
- It is impossible to know for sure what point of the cycle the economy is in, until after it has occurred
Watch:
How the economic machine works by Ray Dalio. One of the best explanations of the economic cycle, period. So cool off the Netflix for one night, open up some popcorn, and watch this video (Its a cartoon!). Click here
Read:
Where Are We in the Current Business Cycle? I really like the part of the post that talks about how to protect your investment in each part of the cycle. Click here

